
The performance.
The full context.
A transparent record of strategy research, simulated results, and the realities of live execution. One contract. Every reporting period in view.
36 months of simulated performance
NET PROFIT · SIMULATED
After $923 in modeled commissions
PROFIT FACTOR
Gross profits ÷ gross losses
MAXIMUM DRAWDOWN
Includes open-trade swings
COMPLETED TRADES
47.4% win rate · 1 MNQ contract
Equity & drawdown
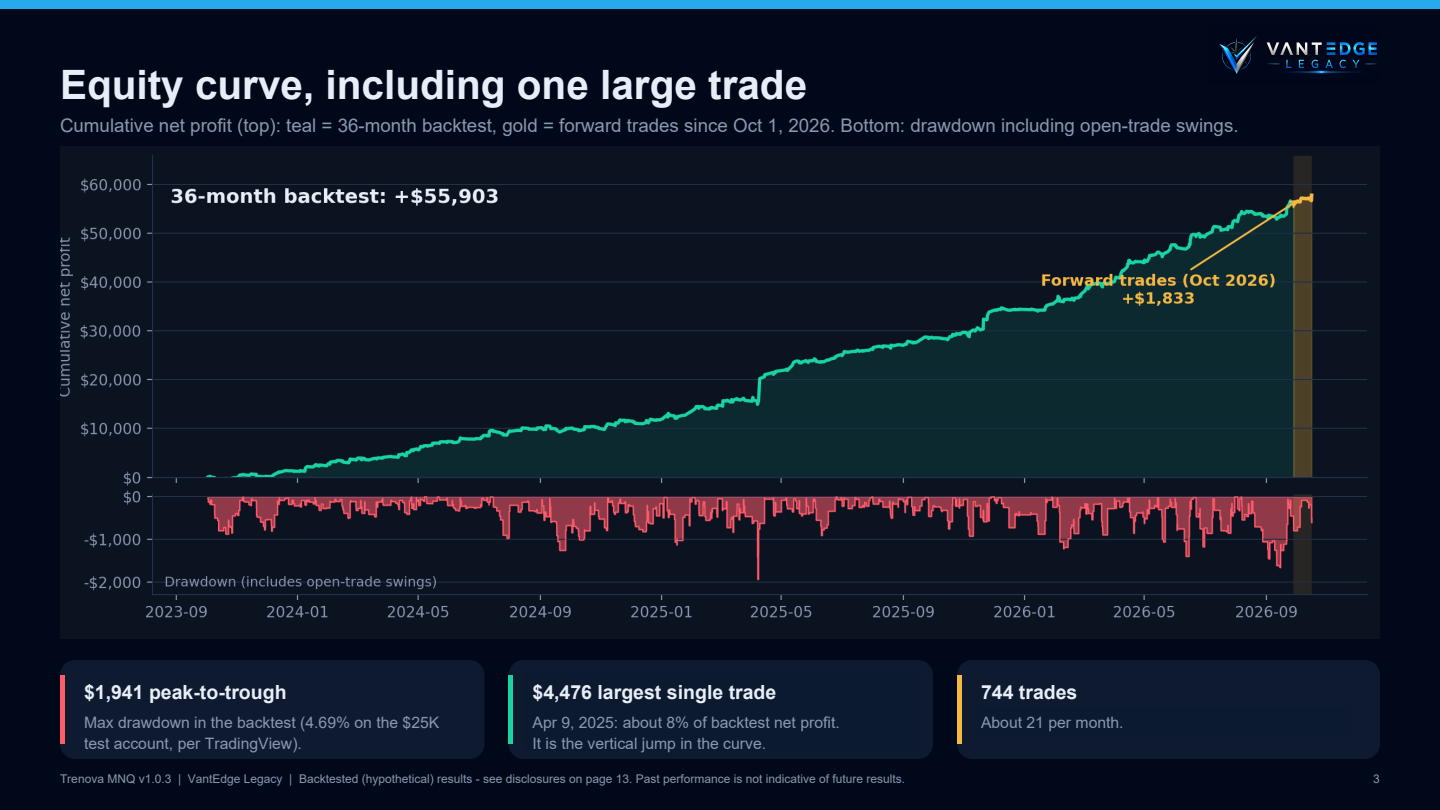
Adapted from performance report, page 3; simulation labels clarified. Chart and PDF are in English. Open the chart to view the original source page.
Largest backtest trade: approximately +$4,476 on April 9, 2025—about 8% of net profit. Excluding that trade, simulated net profit was approximately +$51,427.
34 of 36 months finished in profit
Monthly simulated net P&L · October 2023–September 2026
Green: profitable month. Red: losing month. Dash: outside the backtest window.
| Year | Jan | Feb | Mar | Apr | May | Jun | Jul | Aug | Sep | Oct | Nov | Dec | Year total |
|---|---|---|---|---|---|---|---|---|---|---|---|---|---|
| 2023 | — | — | — | — | — | — | — | — | — | −$87 | +$264 | +$1,082 | +$1,260 |
| 2024 | +$1,523 | +$752 | +$550 | +$1,678 | +$1,600 | +$564 | +$1,552 | +$607 | −$155 | +$69 | +$1,540 | +$205 | +$10,484 |
| 2025 | +$1,818 | +$1,212 | +$961 | +$5,957 | +$2,163 | +$1,197 | +$1,228 | +$745 | +$1,502 | +$1,174 | +$4,263 | +$440 | +$22,662 |
| 2026 | +$1,060 | +$2,007 | +$2,200 | +$4,297 | +$3,613 | +$1,606 | +$3,419 | +$888 | +$2,406 | — | — | — | +$21,497 |
Rounded figures from report page 4; monthly values may not sum exactly to reported yearly totals. October 2026 is excluded and shown separately below.
Hypothetical backtest results, not live-account returns. Past performance does not guarantee future results.
View source report · page 4 ↗Post-backtest simulation record
Net simulated profit after the historical test window closed, using the same strategy version.
Nine trades is a small sample. These results are not verified brokerage-account P&L or proof of future returns.
| Metric | Backtest | Post-backtest |
|---|---|---|
| Net P&L | +$55,903 | +$1,833 |
| Trade count | 744 | 9 |
| Win rate | 47.4% | 55.6% |
| Profit factor | 2.24 | 3.40 |
| Average trade | +$75 | +$204 |
| Average winner | +$286 | +$519 |
| Average loser | −$116 | −$191 |
| Worst trade | −$616 | −$392 |
Both columns are simulated. Values are rounded as presented in the source report.
Total simulated net P&L
Backtest + post-backtest simulation · 753 trades
Oct 1, 2023–Oct 16, 2026 · After modeled commissions · Not live-account returns
+$55,903 backtest + $1,833 post-backtest simulation
Signals and fills are different records.
Live strategy-only P&L
is not yet reported.
The brokerage account included automated entries, manually managed exits, and separate discretionary trades. Those activities cannot be treated as the simulated strategy’s live track record.
PMT pauses also meant that some TradingView signals did not become brokerage trades.
- September–October 2026Trenova entries executed through PickMyTrade when enabled. Most exits were managed manually.
- Automation pauses & discretionary tradesExecution differed from the Strategy Tester record. Strategy-only live P&L has not been sufficiently reconciled.
- October 18, 2026 — automation enabledAs reported by VantEdge Legacy, full entry-and-exit automation through PickMyTrade was enabled as of October 18, 2026. Reconciled live-account results are not yet reported on this page.
Read the detail. Keep the history.
Trenova MNQ v1.0.3 · Performance Report
13 pages · Historical backtest, simulated extension, risk metrics & PMT pause disclosures
| Results through | Version | Record |
|---|---|---|
| October 16, 2026 | v1.0.3 | View PDF ↗ |
Dated report editions are preserved here as new reports are added. The latest available edition is listed above.
Read the numbers in context.
What these performance figures represent
All figures and charts shown here come from the supplied TradingView Strategy Tester report. The historical backtest covers October 1, 2023 through September 30, 2026. The simulated extension covers nine trades entered October 1–16, 2026. Neither record represents actual live-account returns. Strategy rules were developed with the benefit of hindsight on historical data.
Position sizing, commissions & drawdown
The test uses a fixed position size of one Micro E-mini Nasdaq-100 futures contract (MNQ), a $25,000 starting balance, and modeled commissions of $1.24 per round trip. Maximum drawdown includes unrealized losses on open trades. Real-world slippage, liquidity, partial fills, latency and outages may produce materially different results.
Live execution & future updates
Before October 18, 2026, PMT was sometimes paused, most live exits were manually managed, and separate discretionary trades occurred in the same account. VantEdge Legacy reports that full entry-and-exit automation through PickMyTrade was enabled as of October 18, 2026. Reconciled Trenova-only live P&L is not yet reported here. This page is a report-based snapshot, not a live feed. Updates are based on new source reports or reconciled trade data.
Risk disclosure
Hypothetical performance has inherent limitations. No representation is made that any account will achieve profits or losses similar to those shown. Past performance, actual or simulated, is not indicative of future results. Futures trading involves substantial risk of loss and may result in losses greater than your initial investment. This material is educational and is not investment advice or a solicitation to trade. See page 13 of the report for the full disclosures.